
The nutritional role of meat in the human diet has undergone a significant shift. Modern nutritional standards—such as updated dietary frameworks—increasingly highlight the of adequate protein intake, moving away from grain-heavy recommendations toward higher-protein, balanced lifestyle models. Understanding the precise protein yields, amino acid profiles, and micronutrient densities of various animal proteins is essential for anyone looking to optimize athletic performance, support metabolic health, or structure a therapeutic dietary plan.
(Reference: Recent Progress in Nutrition | Red Meat Consumption and Rheumatic Diseases: A Comprehensive Narrative Review)Navigating the nutritional landscape of meat requires more than just knowing a generalized protein count. Different cuts, species, and preparation methods vary wildly in their fat-to-protein ratios, total caloric load, and micronutrient delivery. This guide provides a comprehensive framework, breaking down everything from macro breakdowns to biological availability, helping you master the nuances of animal protein consumption.
Explore our detailed breakdown on Striped Cat Breeds.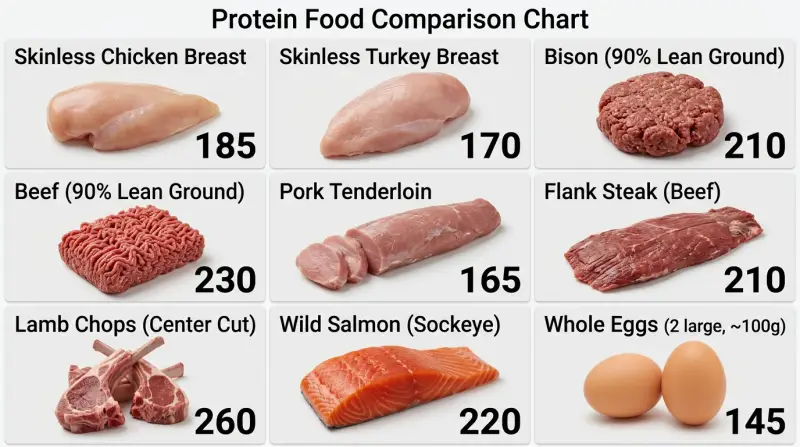
Understanding the Comprehensive Meat Protein Chart
- Most standard animal proteins deliver a reliable baseline of approximately 7 grams of complete protein per ounce (or roughly 28 grams per 4-ounce serving).
- Heme iron found in meat is significantly more bioavailable than non-heme iron found in plant sources, enhancing overall mineral status.
- Modern nutritional guidelines emphasize daily protein targets of 1.2 to 1.6 grams per kilogram of body weight to support optimal metabolic function.
- Lean cuts such as skinless poultry, pork tenderloin, and extra-lean ground beef offer high protein density with minimal saturated fat.
- Red meats provide a rich matrix of zinc, selenium, and B-complex vitamins, particularly B12, which are difficult to source in equivalent bioavailability elsewhere.
- Amino acid profiles in meat are complete, meaning they supply all nine essential amino acids required by the human body in sufficient quantities.
To make informed nutritional decisions, you must look at how different proteins compare side-by-side. The following data outlines the macronutrient breakdown of standard 4-ounce (113-gram) cooked portions of common animal proteins. These values reflect typical lean-to-moderate fat cuts, standard cooking methods without heavy added oils, and standardized USDA nutritional baselines.
| Meat Protein Source (4 oz / 113g cooked) | Calories | Protein (g) | Total Fat (g) | Saturated Fat (g) | Key Micronutrients |
|---|---|---|---|---|---|
| Skinless Chicken Breast | 185 | 35g | 4g | 1g | Niacin, Selenium, Vitamin B6 |
| Skinless Turkey Breast | 170 | 32g | 3g | 1g | Phosphorus, Selenium, B-Vitamins |
| Bison (90% Lean Ground) | 210 | 28g | 10g | 4g | Heme Iron, Zinc, Vitamin B12 |
| Beef (90% Lean Ground) | 230 | 26g | 13g | 5g | Iron, Zinc, Selenium, B12 |
| Pork Tenderloin | 165 | 30g | 4g | 1g | Thiamine (B1), Selenium, Zinc |
| Flank Steak (Beef) | 210 | 31g | 8g | 3g | Iron, Zinc, Riboflavin, B12 |
| Lamb Chops (Center Cut) | 260 | 28g | 16g | 7g | Zinc, Vitamin B12, Iron |
| Wild Salmon (Sockeye) | 220 | 30g | 10g | 1.5g | Omega-3 Fatty Acids, Vitamin D |
| Whole Eggs (2 large, ~100g) | 145 | 13g | 10g | 3g | Choline, Selenium, Vitamin A |
When analyzing this data, notice that protein density remains relatively constant across species—hovering near that 7-grams-per-ounce rule—while calorie and fat counts shift depending on the cut and animal fat distribution. This variability allows individuals to fine-tune their nutritional intake based on specific caloric and macronutrient goals.
Visualizing Protein-to-Calorie Efficiency Across Meat Categories
To better understand how different meat proteins stack up in terms of caloric cost relative to muscle-building power, consider the protein-to-calorie ratio. High-efficiency protein sources maximize protein grams while minimizing unnecessary thermal or caloric load.
| Category | Average Protein per 100 Calories | Primary Advantage |
|---|---|---|
| Poultry Breast (Chicken/Turkey) | ~18.5g protein per 100 calories | Highest protein density, lowest fat overhead |
| Lean Pork & Flank Cuts | ~15.0g protein per 100 calories | Balanced macros, high thiamine and B-vitamins |
| Lean Red Meat (Bison / 90%+ Beef) | ~12.5g protein per 100 calories | Superior bioavailable iron and zinc density |
| Fatty Fish & Higher-Fat Meats | ~10.0g protein per 100 calories | Essential fatty acid delivery alongside protein |
Classification and Taxonomy of Animal Proteins
To navigate a meat protein chart effectively, it helps to understand how animal proteins are classified in nutritional and culinary science. Grouping proteins by biological source, fat distribution, and processing level provides clarity for meal planning and clinical dietary design.
1. Poultry (White vs. Dark Meat)
Poultry encompasses avian species raised for consumption, primarily chicken, turkey, duck, and goose. Within this category, a critical distinction exists between white meat (found in the breast and wings, characterized by fast-twitch muscle fibers, lower myoglobin, and minimal fat) and dark meat (found in the thighs and drumsticks, characterized by slow-twitch muscle fibers, higher myoglobin, iron, and intermuscular fat).
2. Ruminant Red Meats
Ruminants are hoofed herbivores with multi-chambered stomachs that ferment plant matter before digestion. This category includes beef, bison, lamb, goat, and venison. Ruminant meat is distinguished by its rich deep-red color from myoglobin, high concentrations of heme iron, and unique fatty acid profiles that include ruminant trans fats like conjugated linoleic acid (CLA).
3. Monogastric Meats
Monogastric animals have a single-chambered stomach, much like humans. This category primarily includes pork and rabbit. Modern breeding and feed innovations have drastically altered monogastric meat profiles, allowing lean cuts like pork tenderloin to rival skinless poultry in fat content while retaining high levels of B-complex vitamins.
4. Finfish and Shellfish
Aquatic proteins provide a distinct matrix characterized by high polyunsaturated omega-3 fatty acid content (EPA and DHA), exceptional tenderness due to short muscle fibers (myotomes), and high levels of fat-soluble vitamins like Vitamin D. They range from lean white fish (cod, tilapia) to oily pelagic species (salmon, mackerel).
The Biochemical Superiority of Animal Protein
Meat protein is classified as a “complete” protein, a biological distinction meaning it supplies all nine essential amino acids—histidine, isoleucine, leucine, lysine, methionine, phenylalanine, threonine, tryptophan, and valine—that the human body cannot synthesize on its own. Among these, leucine plays a primary role as the biochemical trigger for muscle protein synthesis (MPS) via the mechanistic target of rapamycin (mTOR) pathway.
, animal protein is vastly superior in its micronutrient co-factors. Plants contain iron, but it is predominantly in the non-heme form, which binds to phytates and oxalates, significantly lowering its absorption rate. Meat provides heme iron, which bypasses these anti-nutrient blocks and boasts an absorption rate two to three times higher than non-heme sources. This makes meat protein uniquely suited for preventing anemia, supporting cellular oxygenation, and maintaining robust metabolic energy production.
Amino Acid Completeness and Biological Value (BV)
Biological Value measures how efficiently the body can utilize protein absorbed from a specific food source. Whole animal proteins consistently score near the top of the BV scale:
- Whole Eggs: BV ~100
- Cow’s Milk / Whey: BV ~90–104
- Beef / Poultry / Fish: BV ~74–80
- Plant Proteins (Legumes/Grains): BV ~50–70 (requiring food combining to match complete profiles)
Because meat requires zero dietary combination to achieve an optimal amino acid balance, it provides an efficient mechanism for cellular repair, immune function, and structural maintenance.
Poultry: The Benchmark for Lean Protein Density
Poultry remains a staple in fitness, clinical, and everyday nutrition due to its remarkable protein-to-fat ratio. When examining chicken and turkey, the distinction between white meat (breast) and dark meat (thigh, drumstick) is primarily fat content and myoglobin concentration.
Chicken and Turkey Breasts
Skinless poultry breast is virtually pure protein and water. A standard 4-ounce serving yields roughly 32 to 35 grams of protein with only 3 to 4 grams of total fat. This makes it an ideal food for individuals running caloric deficits or managing strict macronutrient ratios.
Dark Meat Poultry
Thighs and legs contain higher myoglobin content, which correlates with richer iron levels, more zinc, and a higher fat content (roughly 8 to 12 grams of fat per serving). While slightly higher in calories, dark meat provides enhanced moisture retention during cooking and a more diverse micronutrient profile.
Red Meat: Nutritional Powerhouses of Iron and Zinc
Red meats—including beef, bison, lamb, and venison—are frequently misunderstood due to generalized historical dietary advice. However, modern nutritional consensus recognizes unprocessed red meat as an exceptional source of dense micronutrients that are difficult to replicate through other food groups.
Beef and Bison
Ground beef graded at 90% lean or higher provides a balanced matrix of saturated and monounsaturated fats alongside heavy loads of Vitamin B12, niacin, and zinc. Bison offers an even leaner alternative, frequently containing less intramuscular fat than skinless chicken thighs while retaining the deep iron profile characteristic of ruminant animals.
Lamb and Game Meats
Lamb, venison, and elk introduce healthy variations in fatty acid profiles, often containing higher amounts of conjugated linoleic acid (CLA) when pasture-raised. These meats supply dense concentrations of sulfur-containing amino acids crucial for glutathione synthesis, the body’s master endogenous antioxidant.
Pork and Alternative Protein Cuts
Pork occupies a unique space on the meat protein chart. Modern breeding practices have produced significantly leaner pork cuts than those available decades ago.
Pork Tenderloin
Pork tenderloin is officially recognized by the USDA as being as lean as skinless chicken breast. A 4-ounce portion delivers approximately 30 grams of protein and only 4 grams of fat. , pork is uniquely rich in thiamine (Vitamin B1), an essential coenzyme required for carbohydrate metabolism and nerve function.
Cured vs. Uncured Considerations
While fresh pork cuts match the nutritional cleanliness of other lean meats, processed pork products (such as bacon and standard sausages) carry significantly higher sodium loads and chemical preservatives. When utilizing a meat protein chart for health optimization, fresh, unprocessed cuts should form the vast majority of dietary intake.
Comparative Analysis: Animal vs. Plant Protein Sources
To fully appreciate the utility of a meat protein chart, it is instructive to compare animal proteins against popular plant-based alternatives across key physiological metrics.
| Nutritional Parameter | Animal Protein (Meat/Poultry/Fish) | Plant Protein (Beans/Lentils/Grains) |
|---|---|---|
| Amino Acid Completeness | Complete (all 9 essential amino acids present) | Incomplete in most single sources (except soy/quinoa) |
| Protein Digestibility-Corrected Amino Acid Score (PDCAAS) | 0.90 to 1.00 (High digestibility) | 0.45 to 0.75 (Lower due to cell walls/antinutrients) |
| Iron Bioavailability | Heme iron (15–35% absorption rate) | Non-heme iron (2–20% absorption, inhibited by phytates) |
| Vitamin B12 Content | Abundant and naturally occurring | Absent unless artificially fortified |
| Caloric Density per 25g Protein | Low to moderate (130–220 calories) | Moderate to high (200–350 calories due to accompanying carbs) |
Practical Application: Integrating Protein Targets Into Daily Life
Current dietary guidelines advise consuming between 1.2 and 1.6 grams of protein per kilogram of body weight daily (with higher targets recommended for athletes, pregnant women, and older adults fighting sarcopenia). Achieving this requires strategic meal planning across daily feeding windows.
Calculating Individual Daily Protein Needs
To find your target range in pounds:
- Convert your body weight in pounds to kilograms (divide by 2.2).
- Multiply your weight in kilograms by 1.2 for baseline active maintenance, or up to 1.6 for intensive muscle-building or fat-loss phases.
- Distribute this total evenly across 3 to 4 meals to maximize muscle protein synthesis stimulation thresholds (aiming for roughly 25 to 40 grams of protein per sitting).
Common Mistakes and Pitfalls in Meat Protein Tracking
When tracking meat protein using standard charts, several common calculation and preparation errors can distort your actual intake:
- Weighing Cooked vs. Raw: Most nutrition charts refer to cooked weight unless explicitly labeled “raw.” Meat loses roughly 20% to 25% of its water weight during cooking. Weighing cooked meat on a digital scale prevents underestimating your protein intake.
- Ignoring Cooking Oils: Pan-frying a lean piece of chicken breast in two tablespoons of butter adds nearly 200 calories and 22 grams of fat, completely altering the nutritional profile of the meal.
- Treating All Ground Meats Equally: Assuming “ground beef” is uniform is a frequent error. 80/20 ground beef packs vastly more fat and calories than 96/4 ground sirloin, despite sharing similar raw weights.
- Neglecting Protein Quality Variables: Relying solely on processed luncheon meats or heavily cured proteins introduces excessive sodium and chemical additives that can counteract the metabolic benefits of high protein intake.
Frequently Asked Questions
On average, most standard meats, poultry, and fish yield approximately 7 grams of complete protein per ounce when cooked. Therefore, a standard 4-ounce portion will yield roughly 28 grams of protein, varying slightly based on moisture loss and fat content.
Cooking does not destroy the amino acid bonds of protein, but it does cause water evaporation and fat rendering. This concentrates the protein per ounce of cooked meat. However, extreme high-heat cooking (such as charring or deep-frying) can oxidize fats and degrade certain delicate micronutrients.
Heme iron is absorbed directly by intestinal enterocytes via specialized transport mechanisms largely unaffected by dietary inhibitors like phytic acid. Non-heme iron found in plants requires reduction in the gut and is easily blocked by fiber, tea, coffee, and calcium, resulting in significantly lower absorption rates.
Skinless chicken breast, skinless turkey breast, and pork tenderloin tie for the highest protein-to-fat ratios. Each provides over 30 grams of protein per 4-ounce serving while keeping total fat counts under 4 grams.
Recent guidelines place increased emphasis on higher protein and healthy fat consumption while reducing reliance on refined grains and simple carbohydrates. This shift acknowledges that animal proteins provide essential micronutrients, stable glycemic control, and superior satiety compared to carb-dominant diets.
Conclusion
Mastering the meat protein chart is a foundational step in fine-tuning your nutrition, body composition, and metabolic health. By prioritizing high-quality, nutrient-dense animal proteins—ranging from lean poultry and pork tenderloin to iron-rich beef and wild-caught fish—you ensure your body receives complete amino acid profiles alongside essential bioavailable minerals. Approach your nutritional tracking with precision by measuring cooked weights accurately, selecting quality cuts, and aligning your daily protein intake with modern evidence-based targets.